![]() Download the ClassMarker Essentials Guide
Download the ClassMarker Essentials Guide


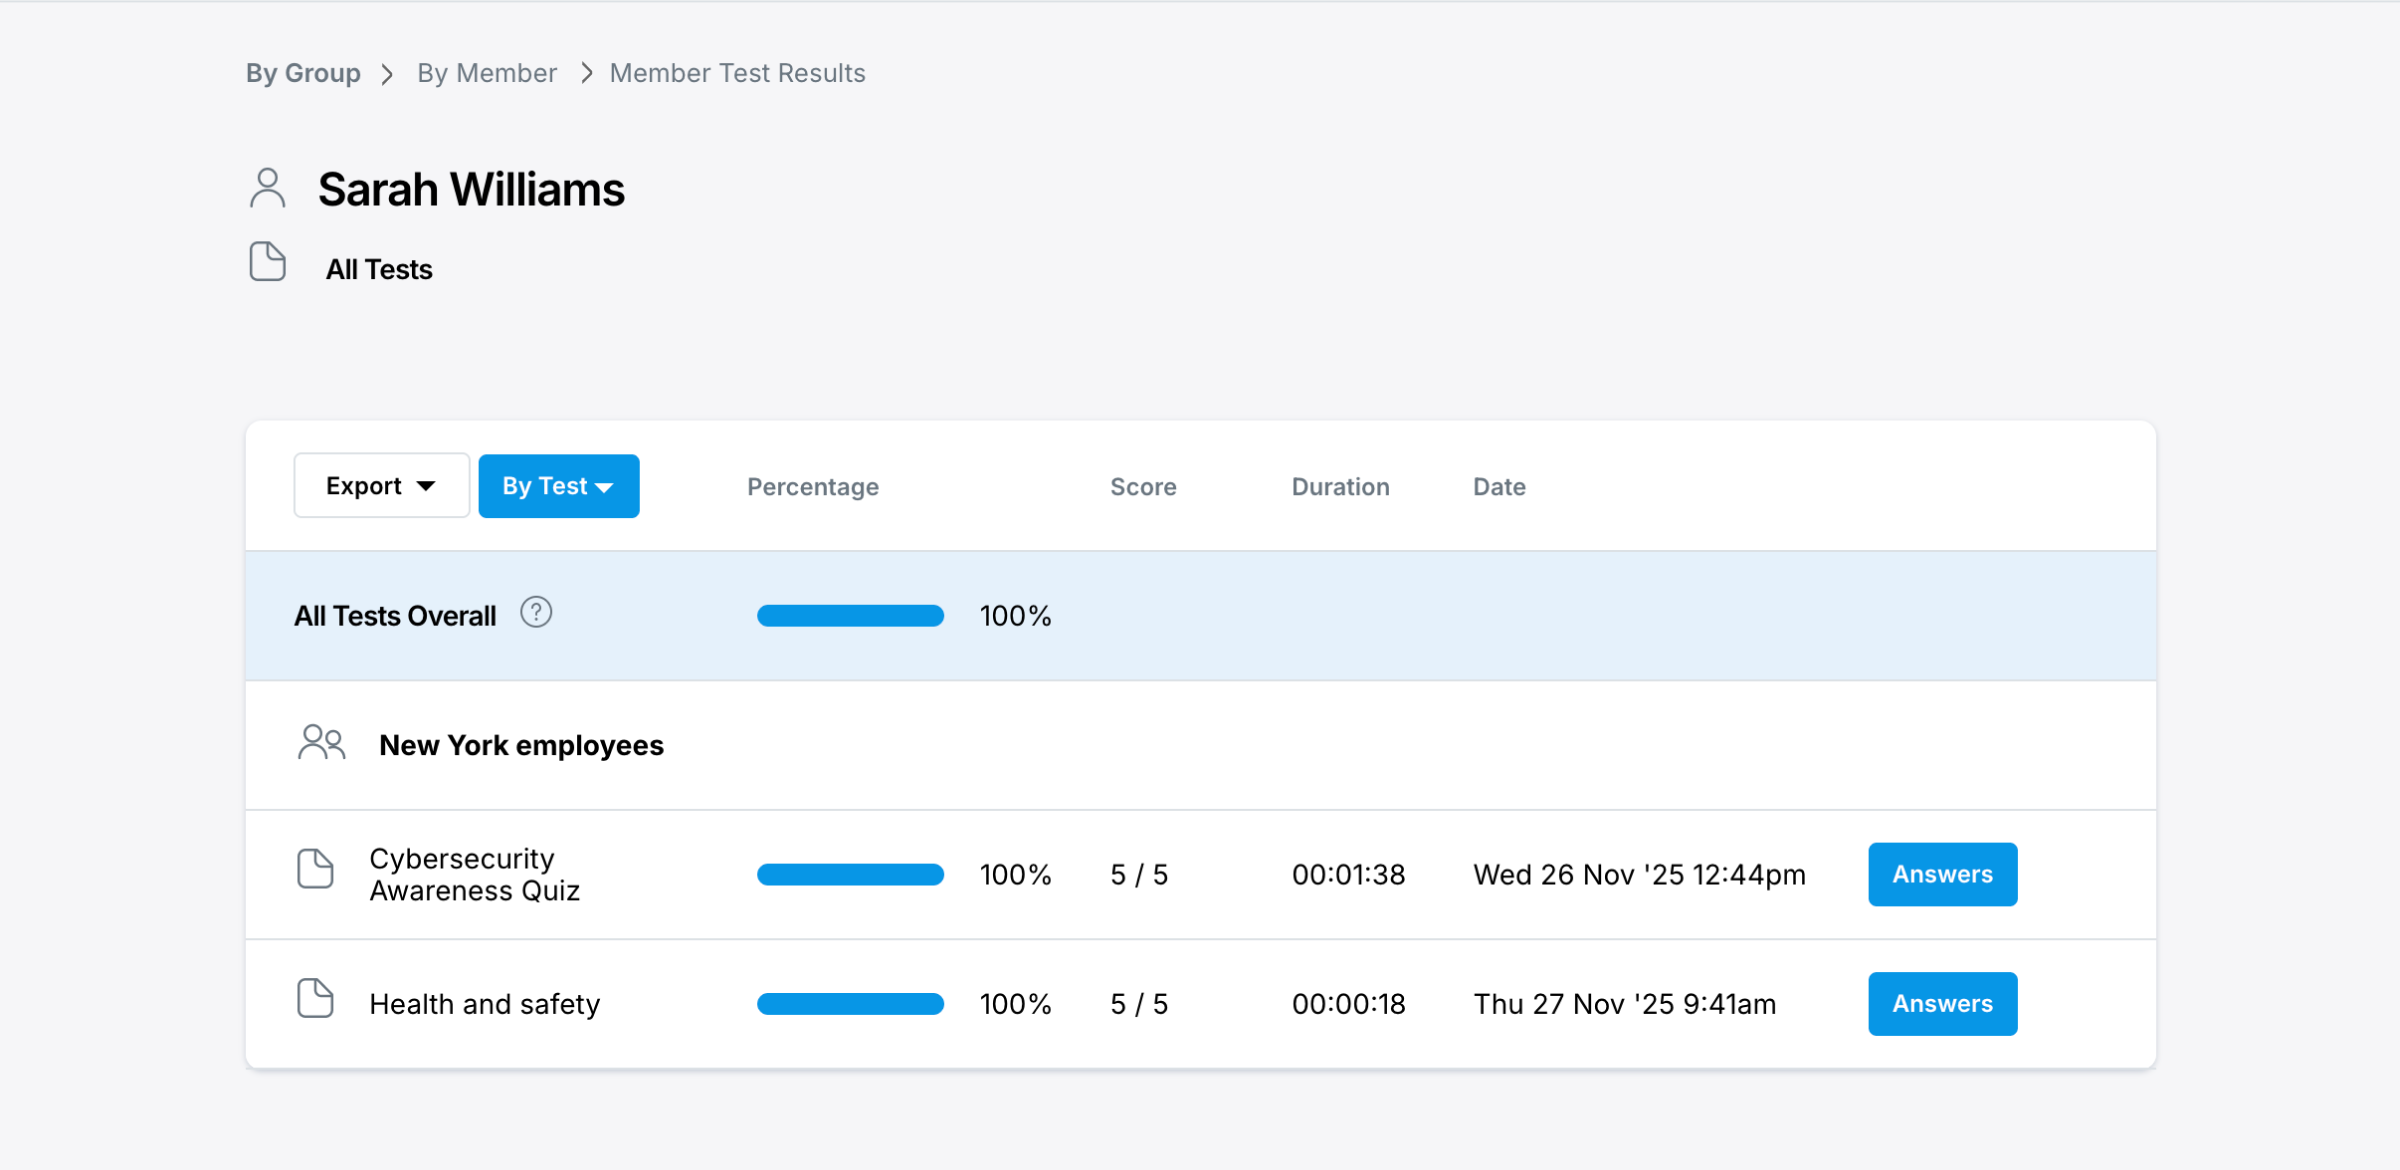
For each assigned test, you can view statistics by question, by category, or compare results across tests.

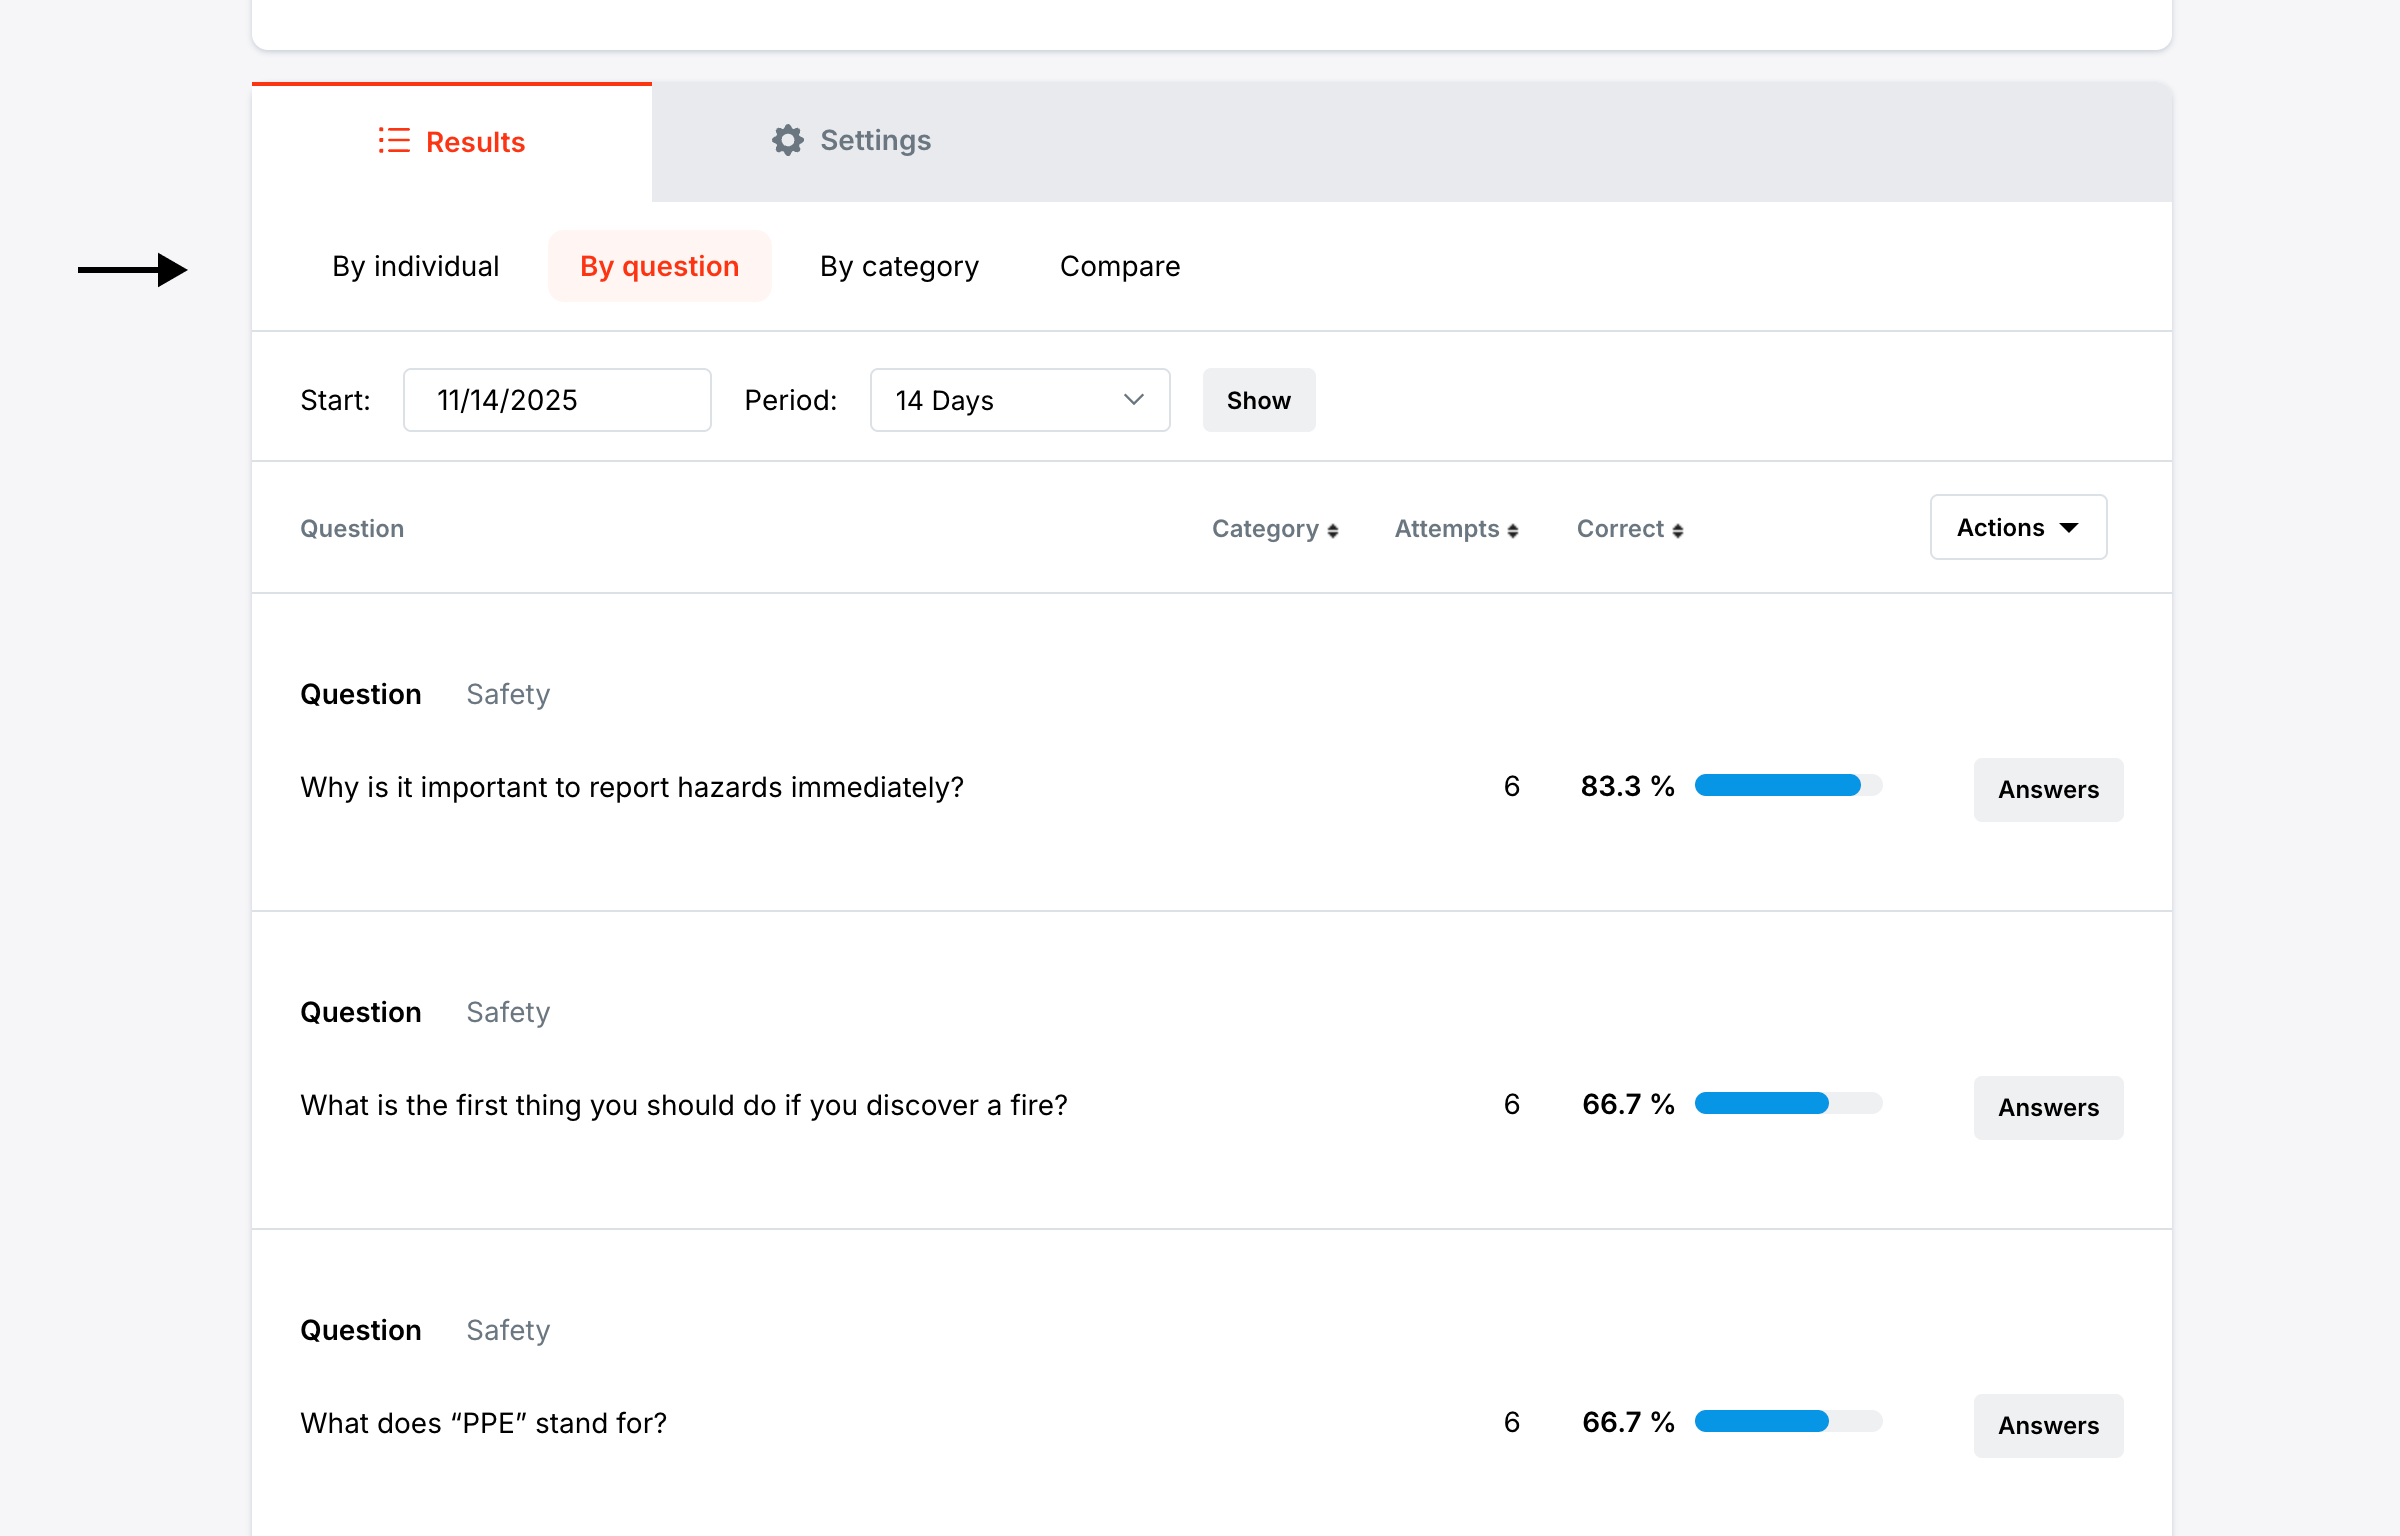
Breakdown by question
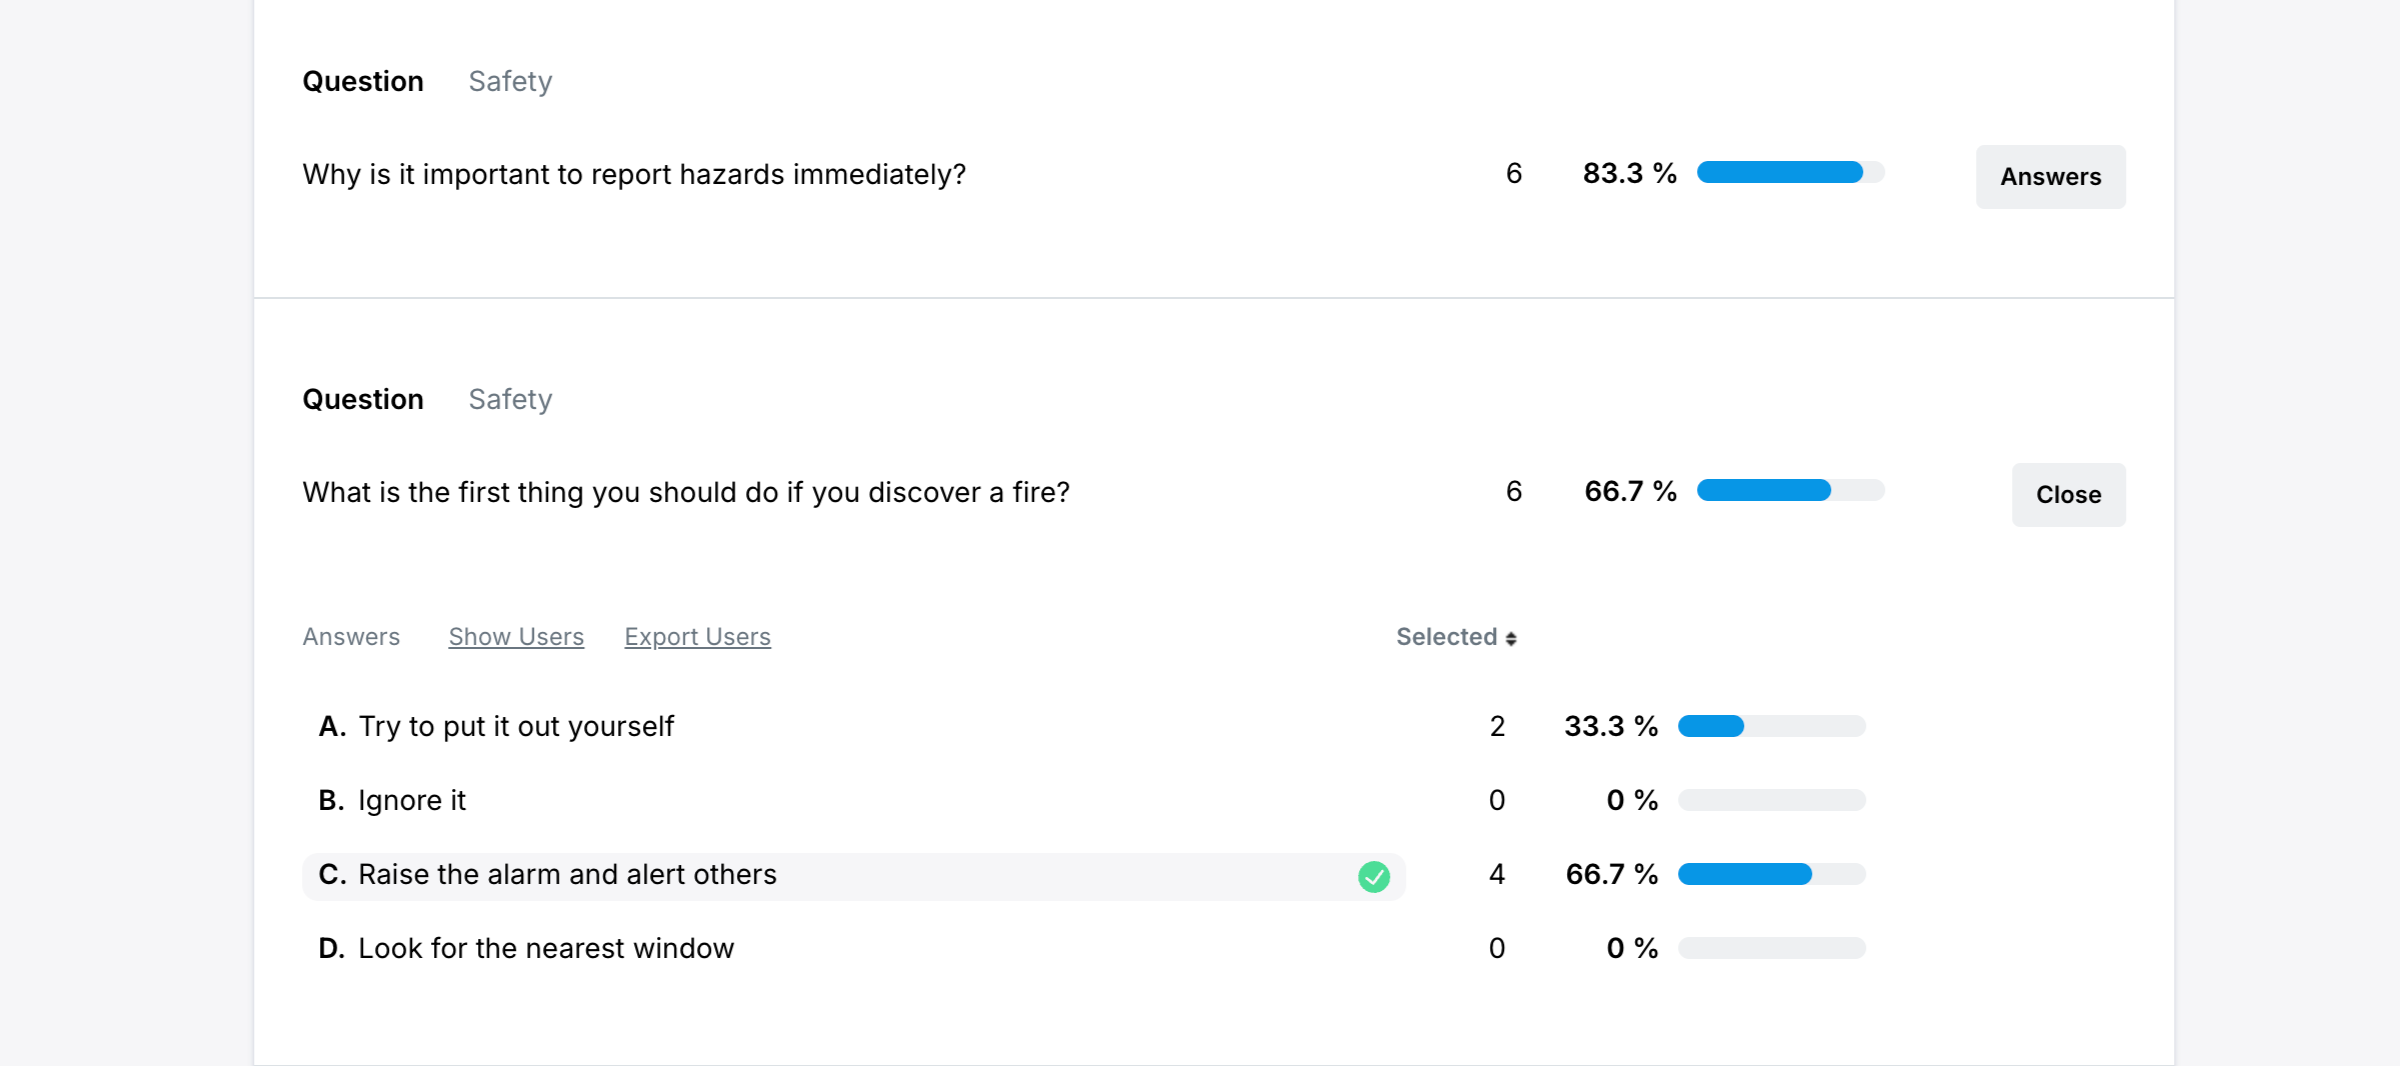
See which questions are easy, difficult, or commonly missed.
You can view the breakdown for each answer, see which option each user selected, and export the list of users.
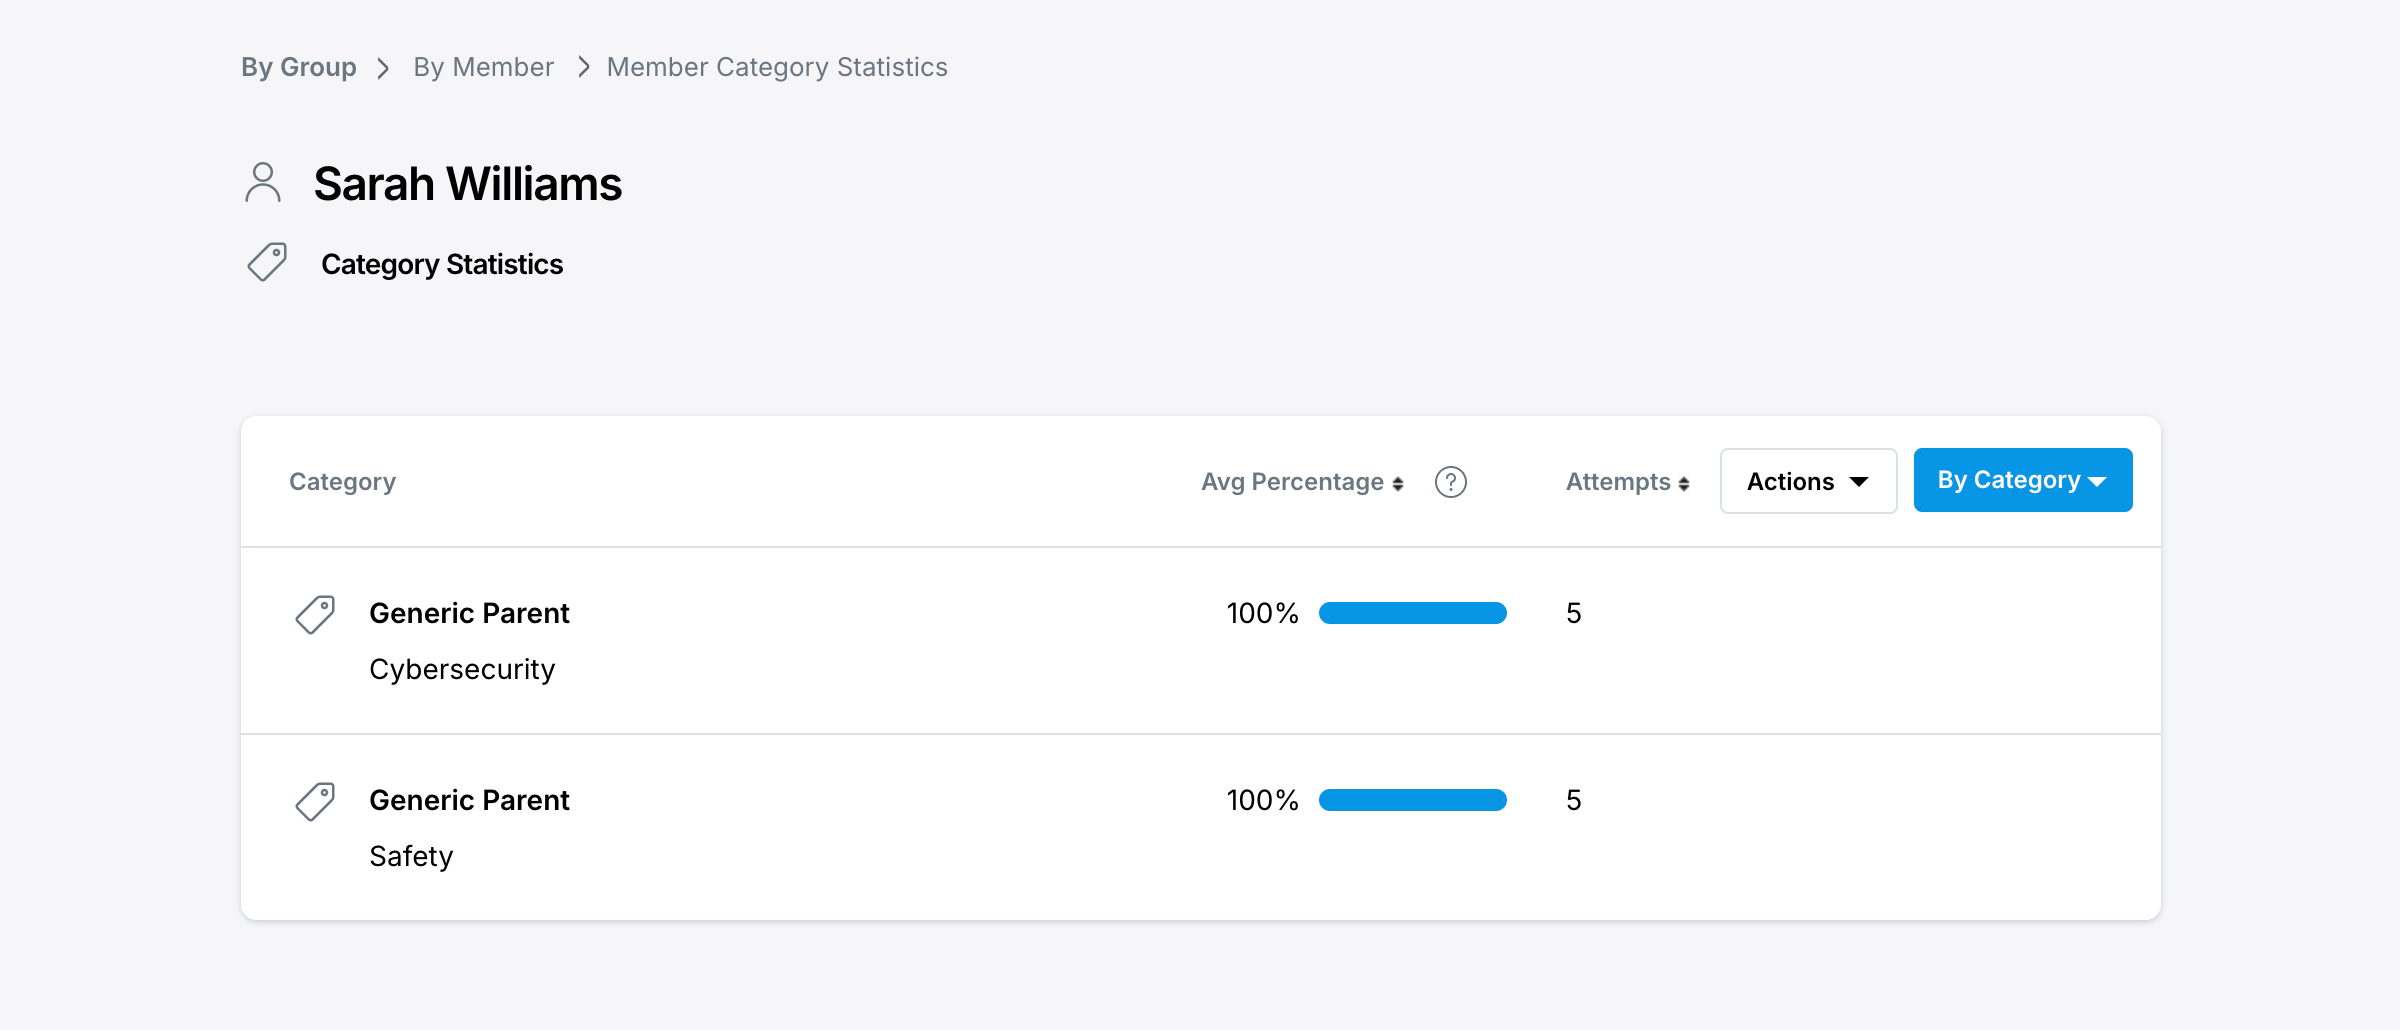
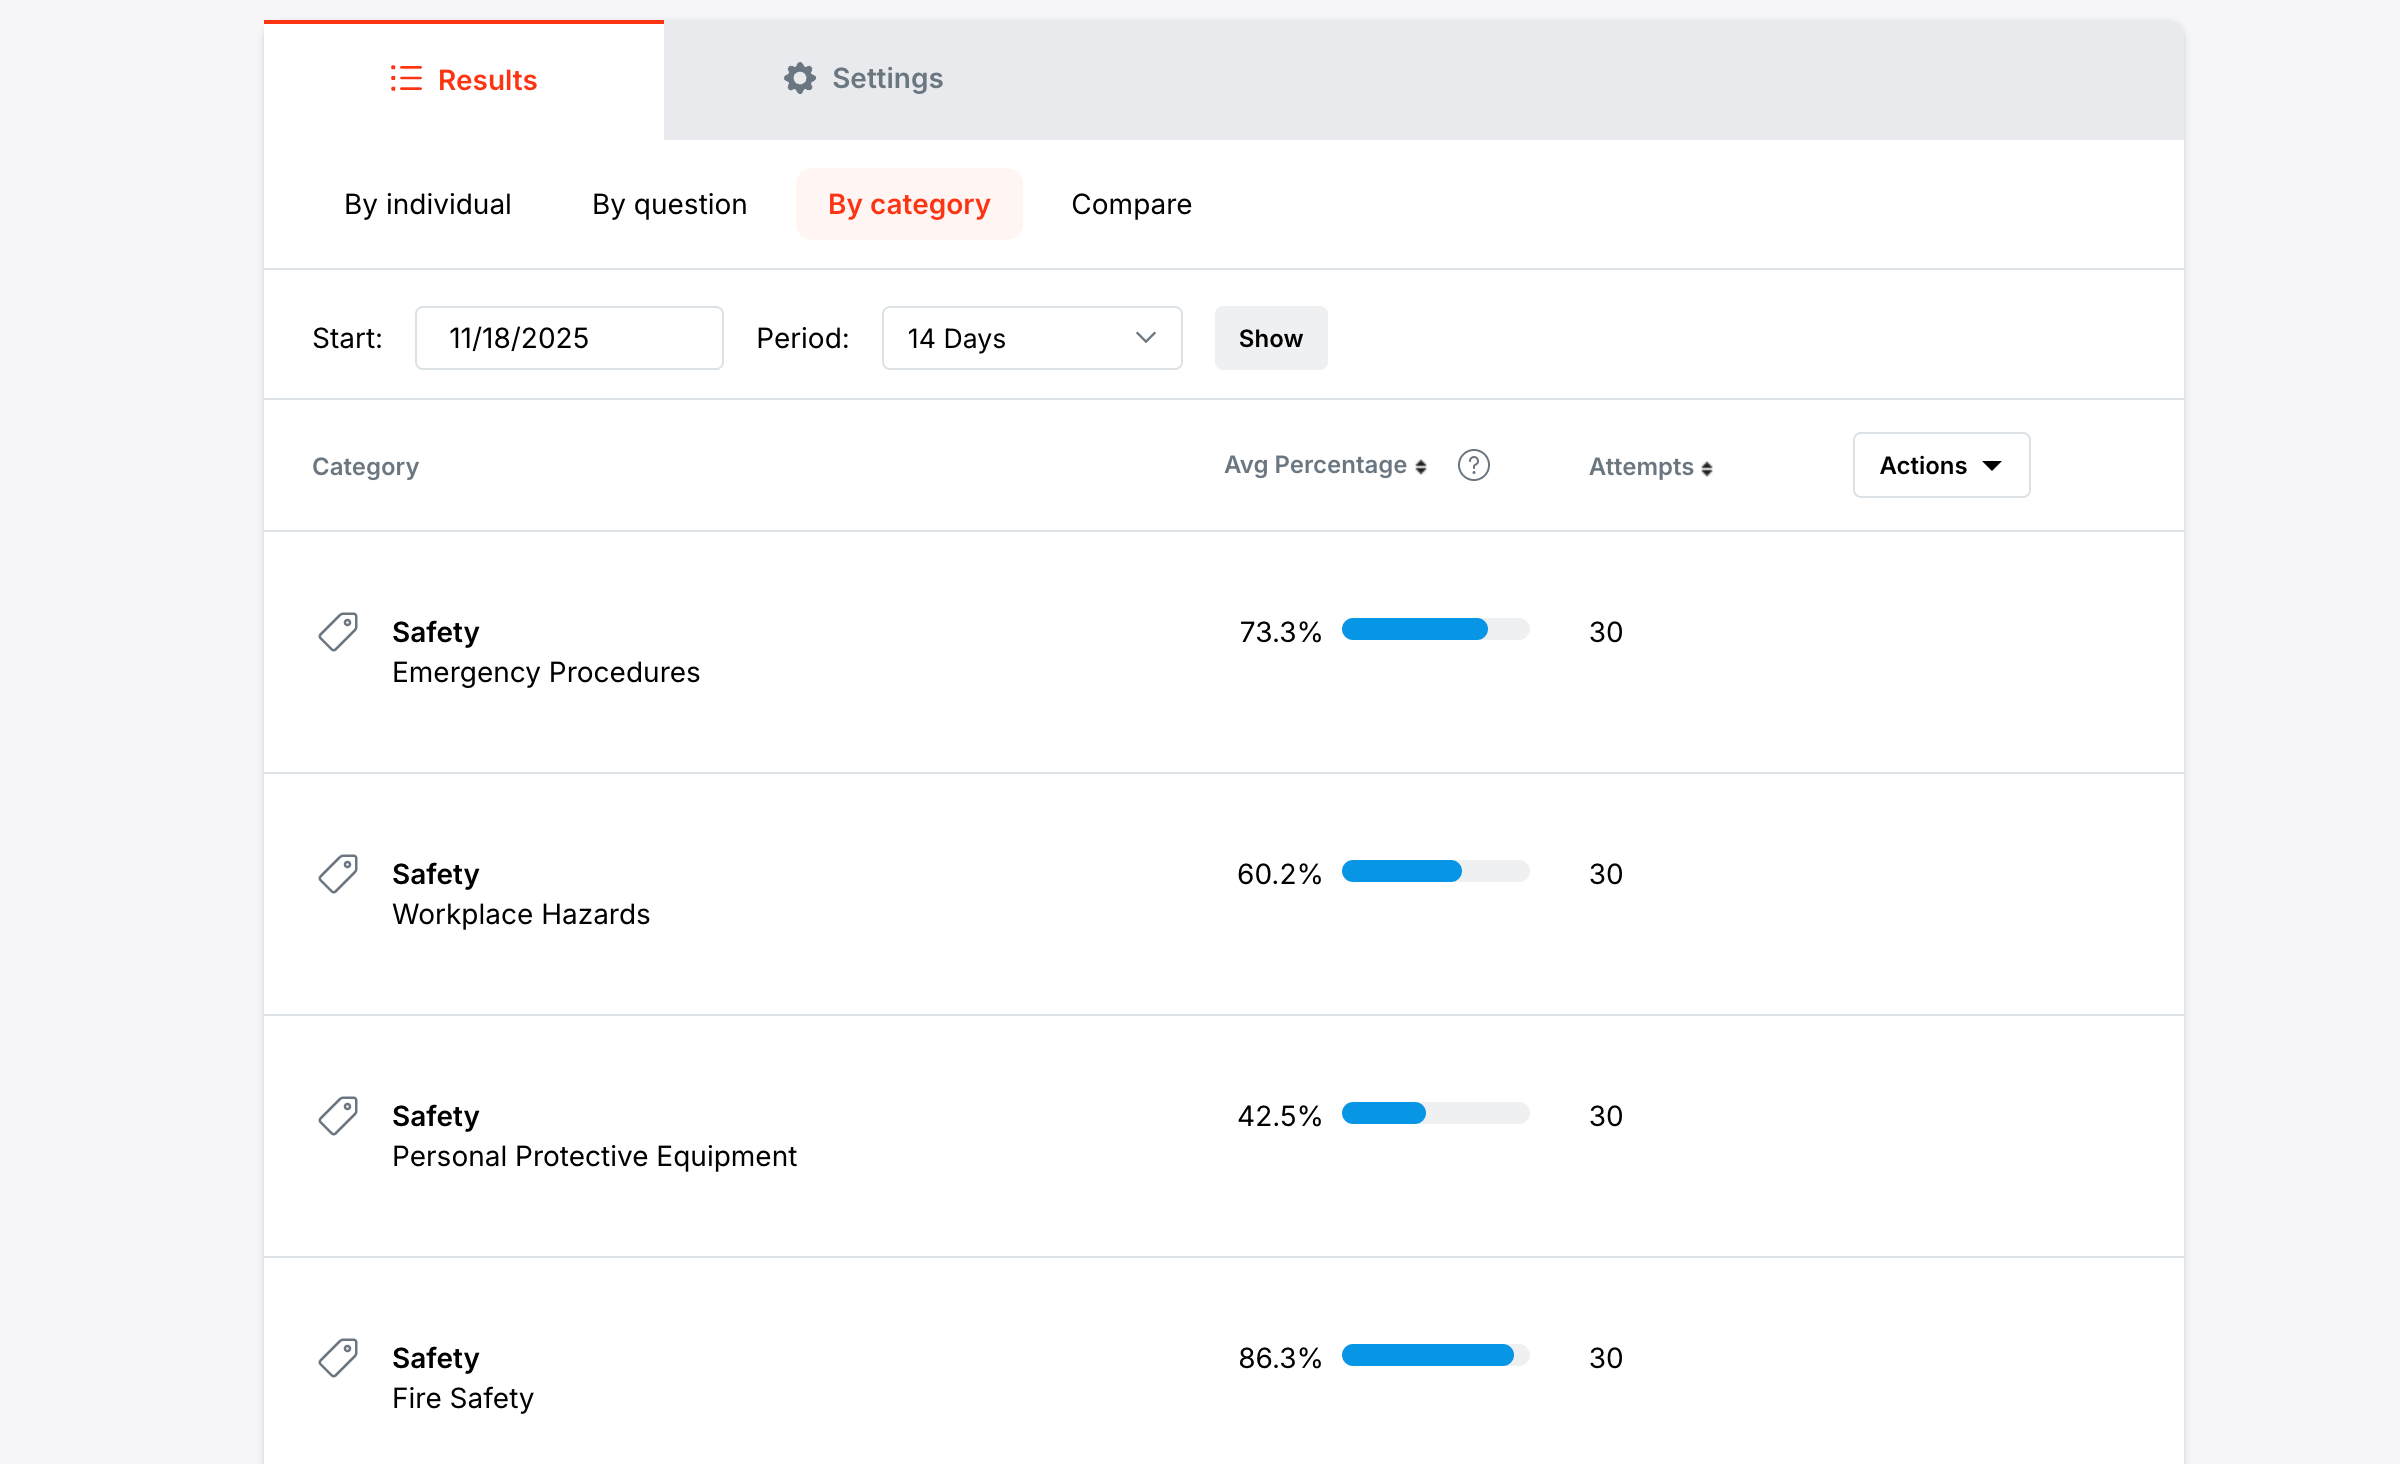
Breakdown by category
Categories provide insight into learner progress across topics and reveal where additional training may be beneficial.
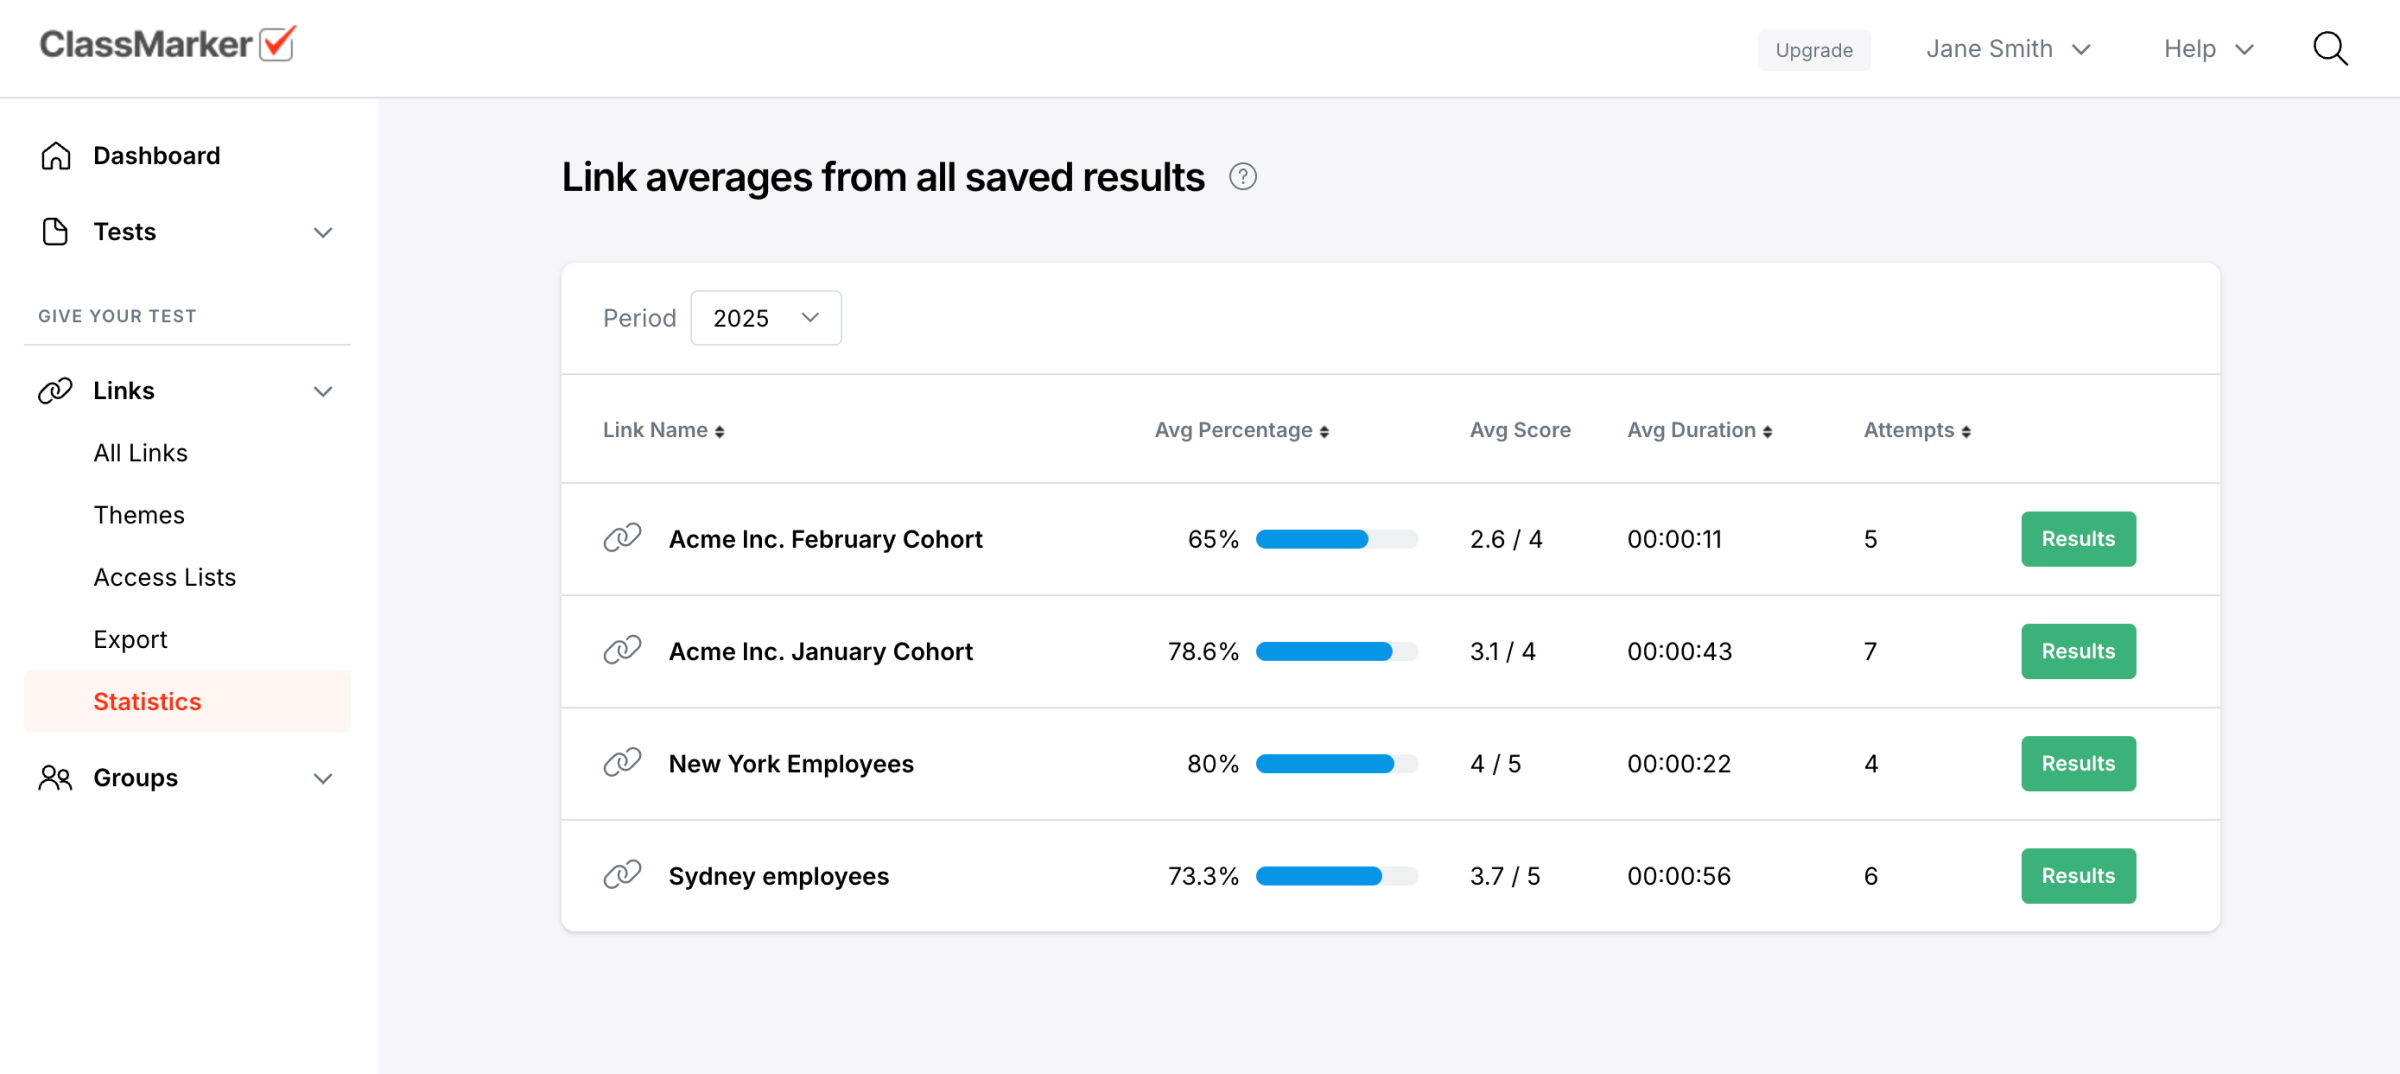
Compare audiences or cohorts
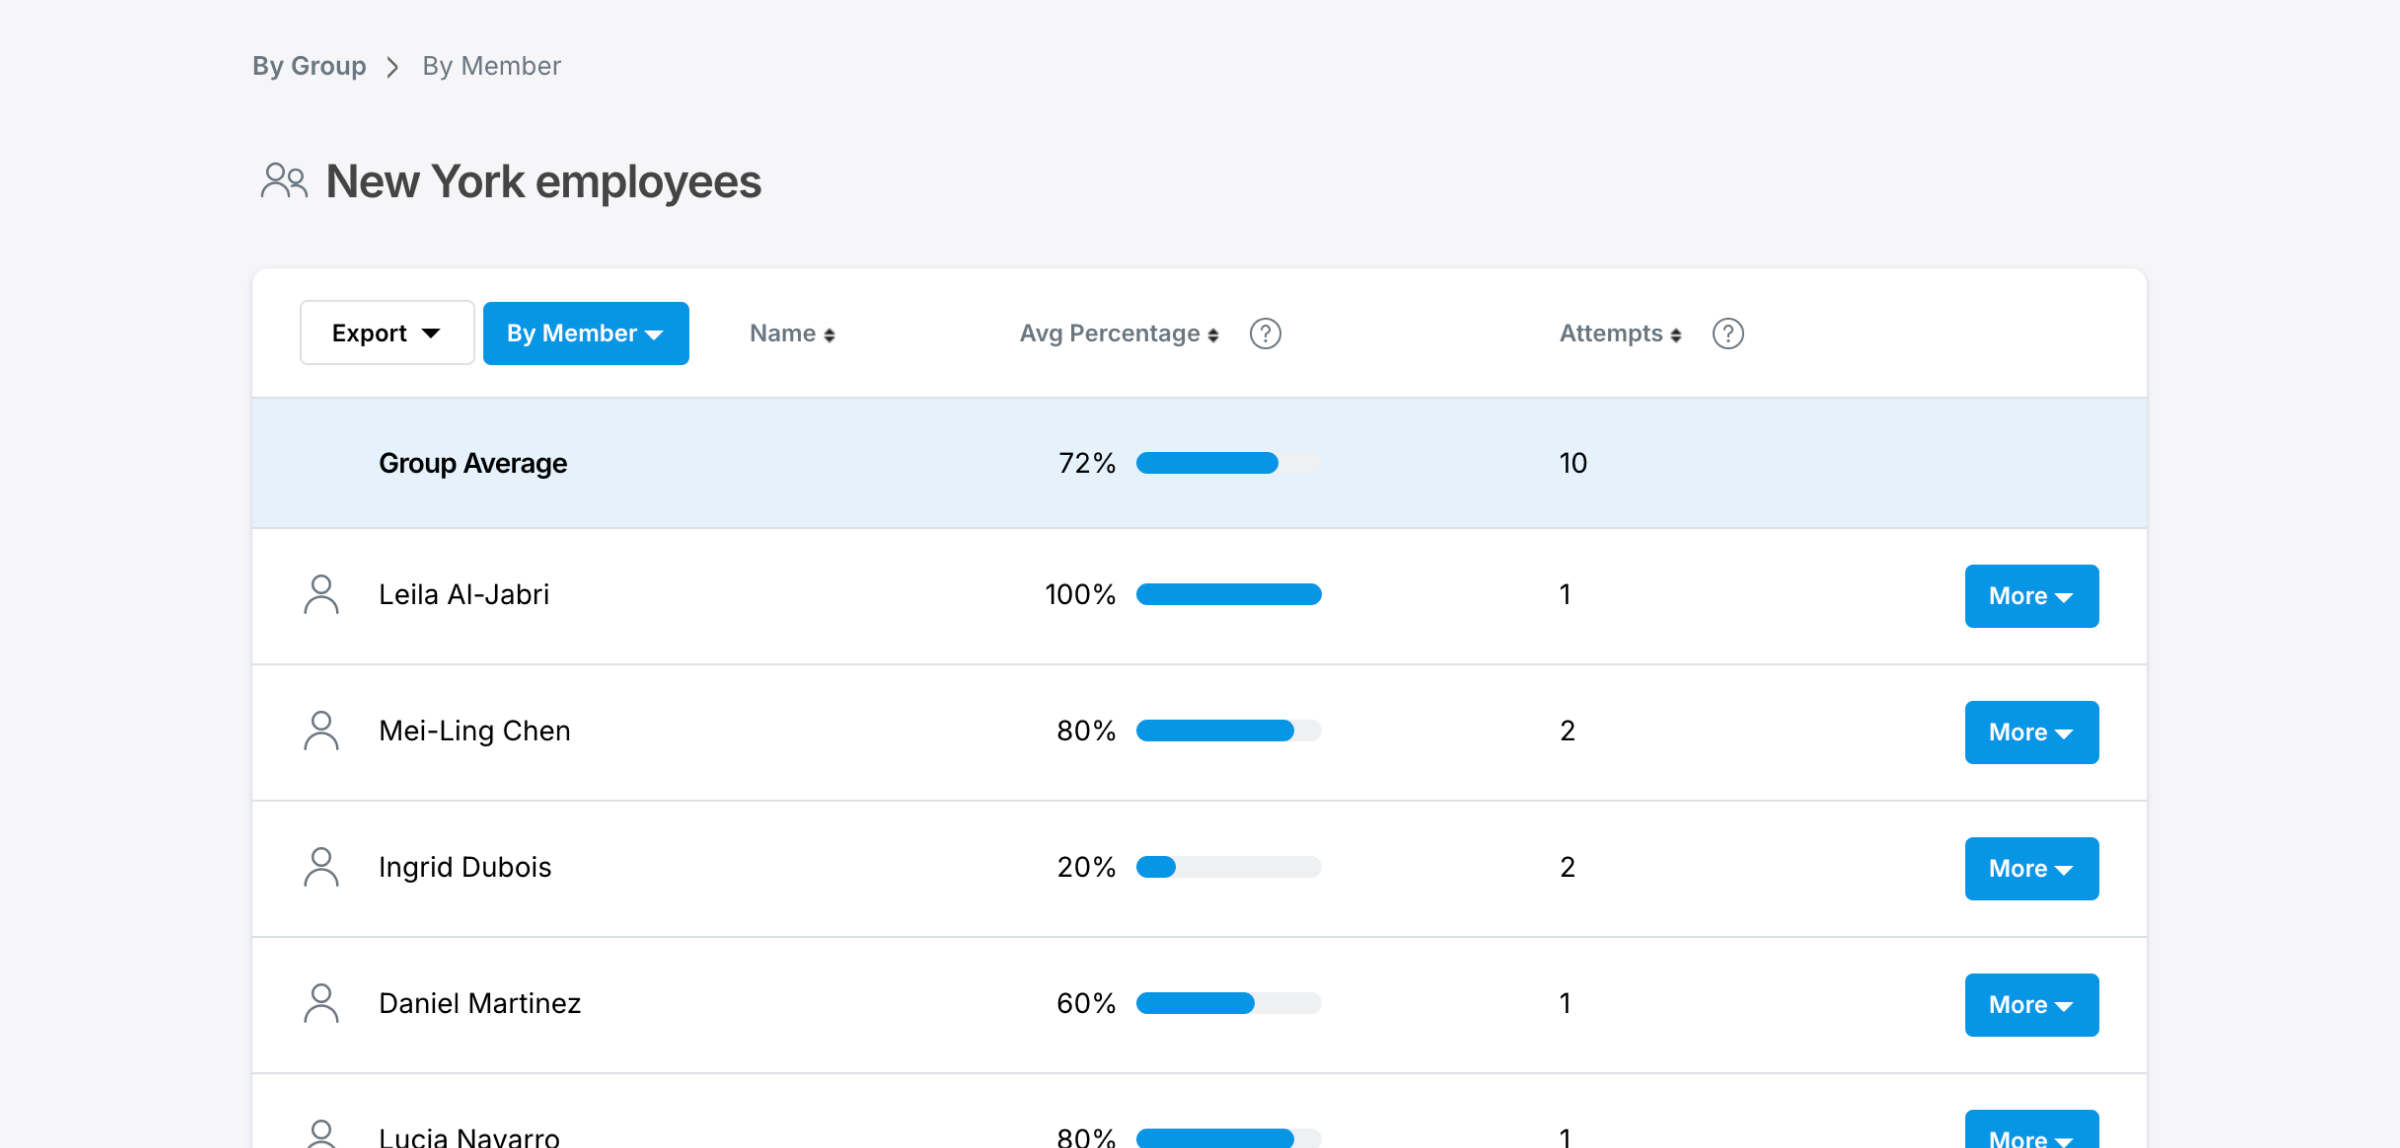
Identify performance differences across audiences for the same test. Only group and link assignments for that test are included in this comparison.
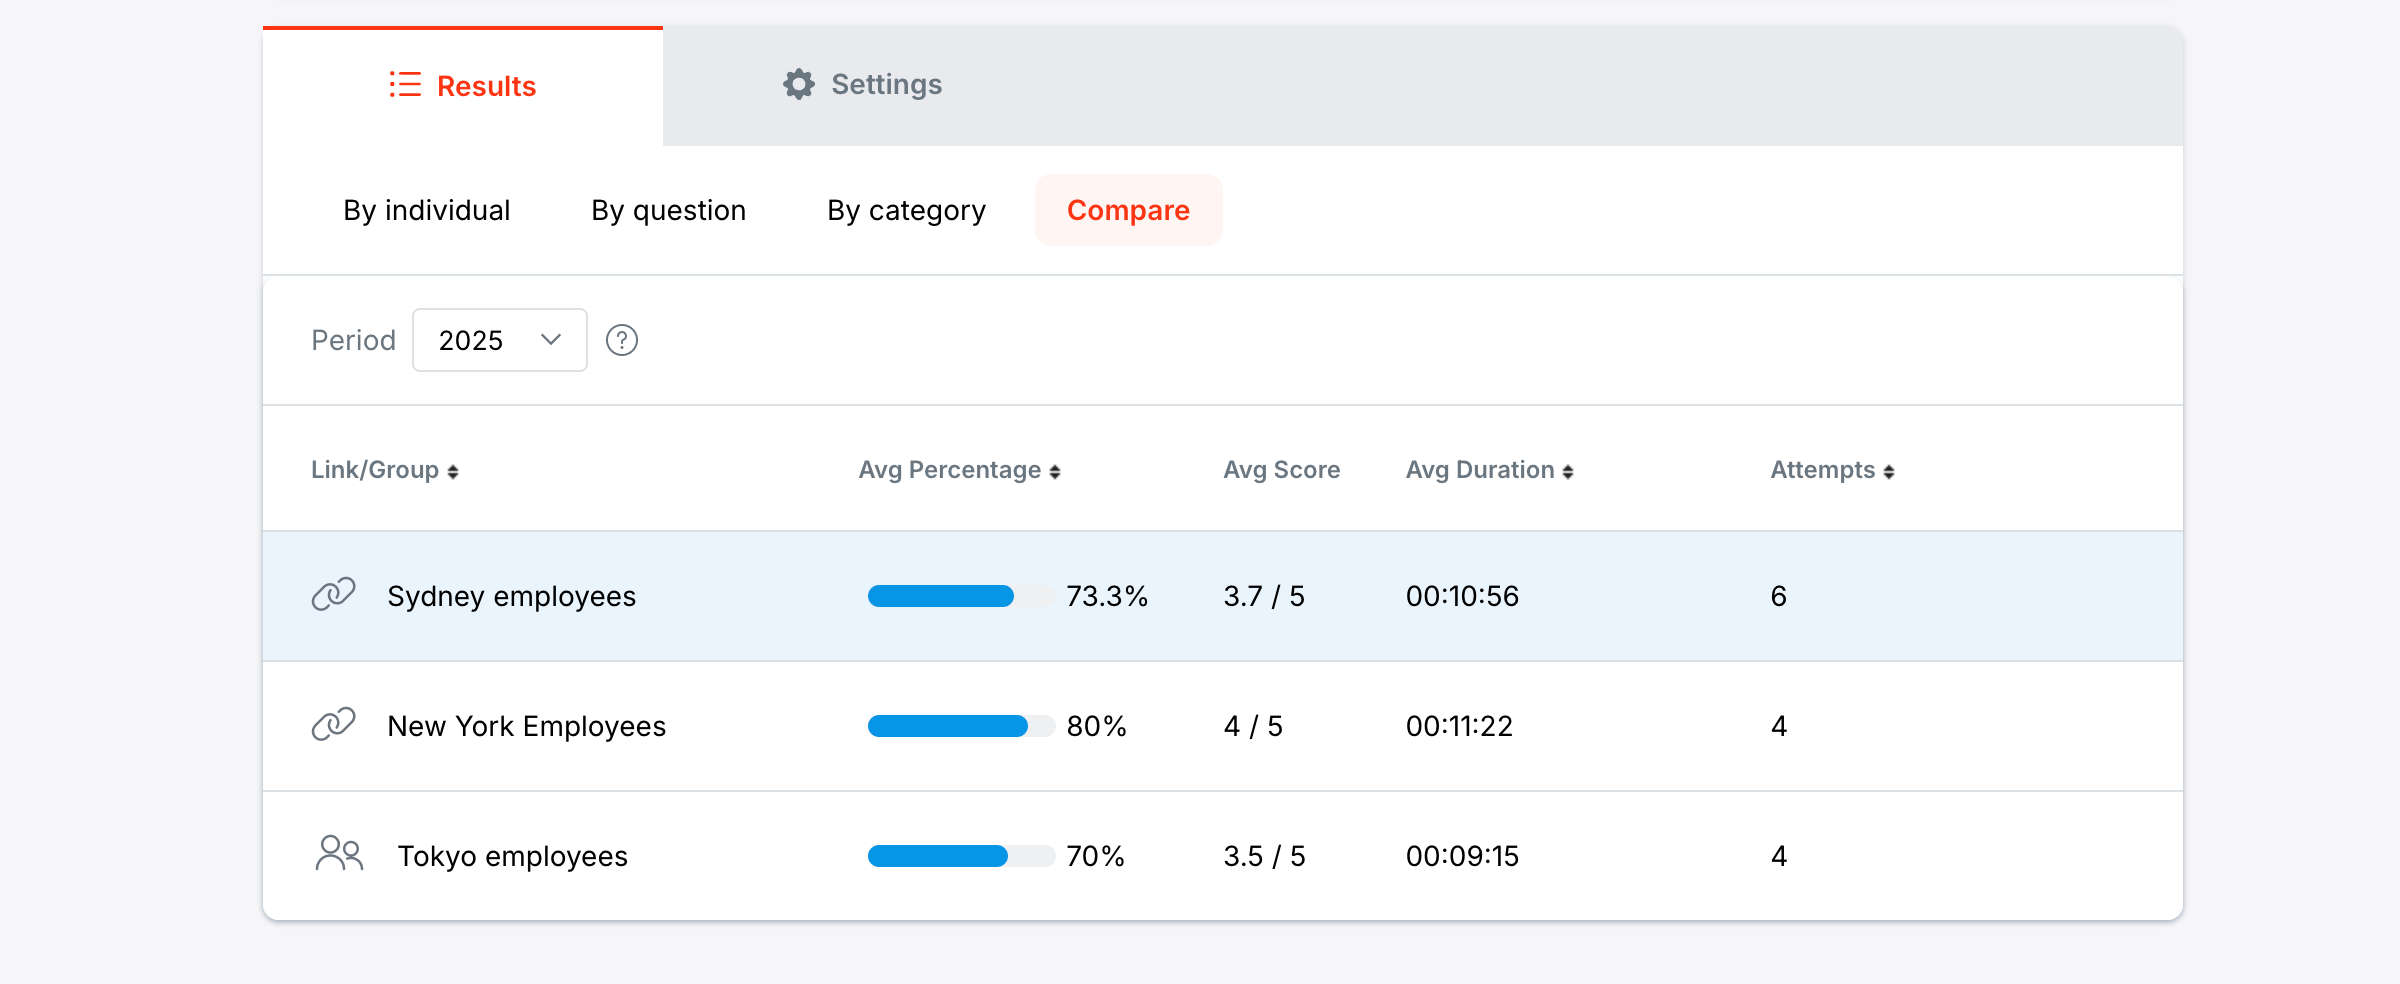
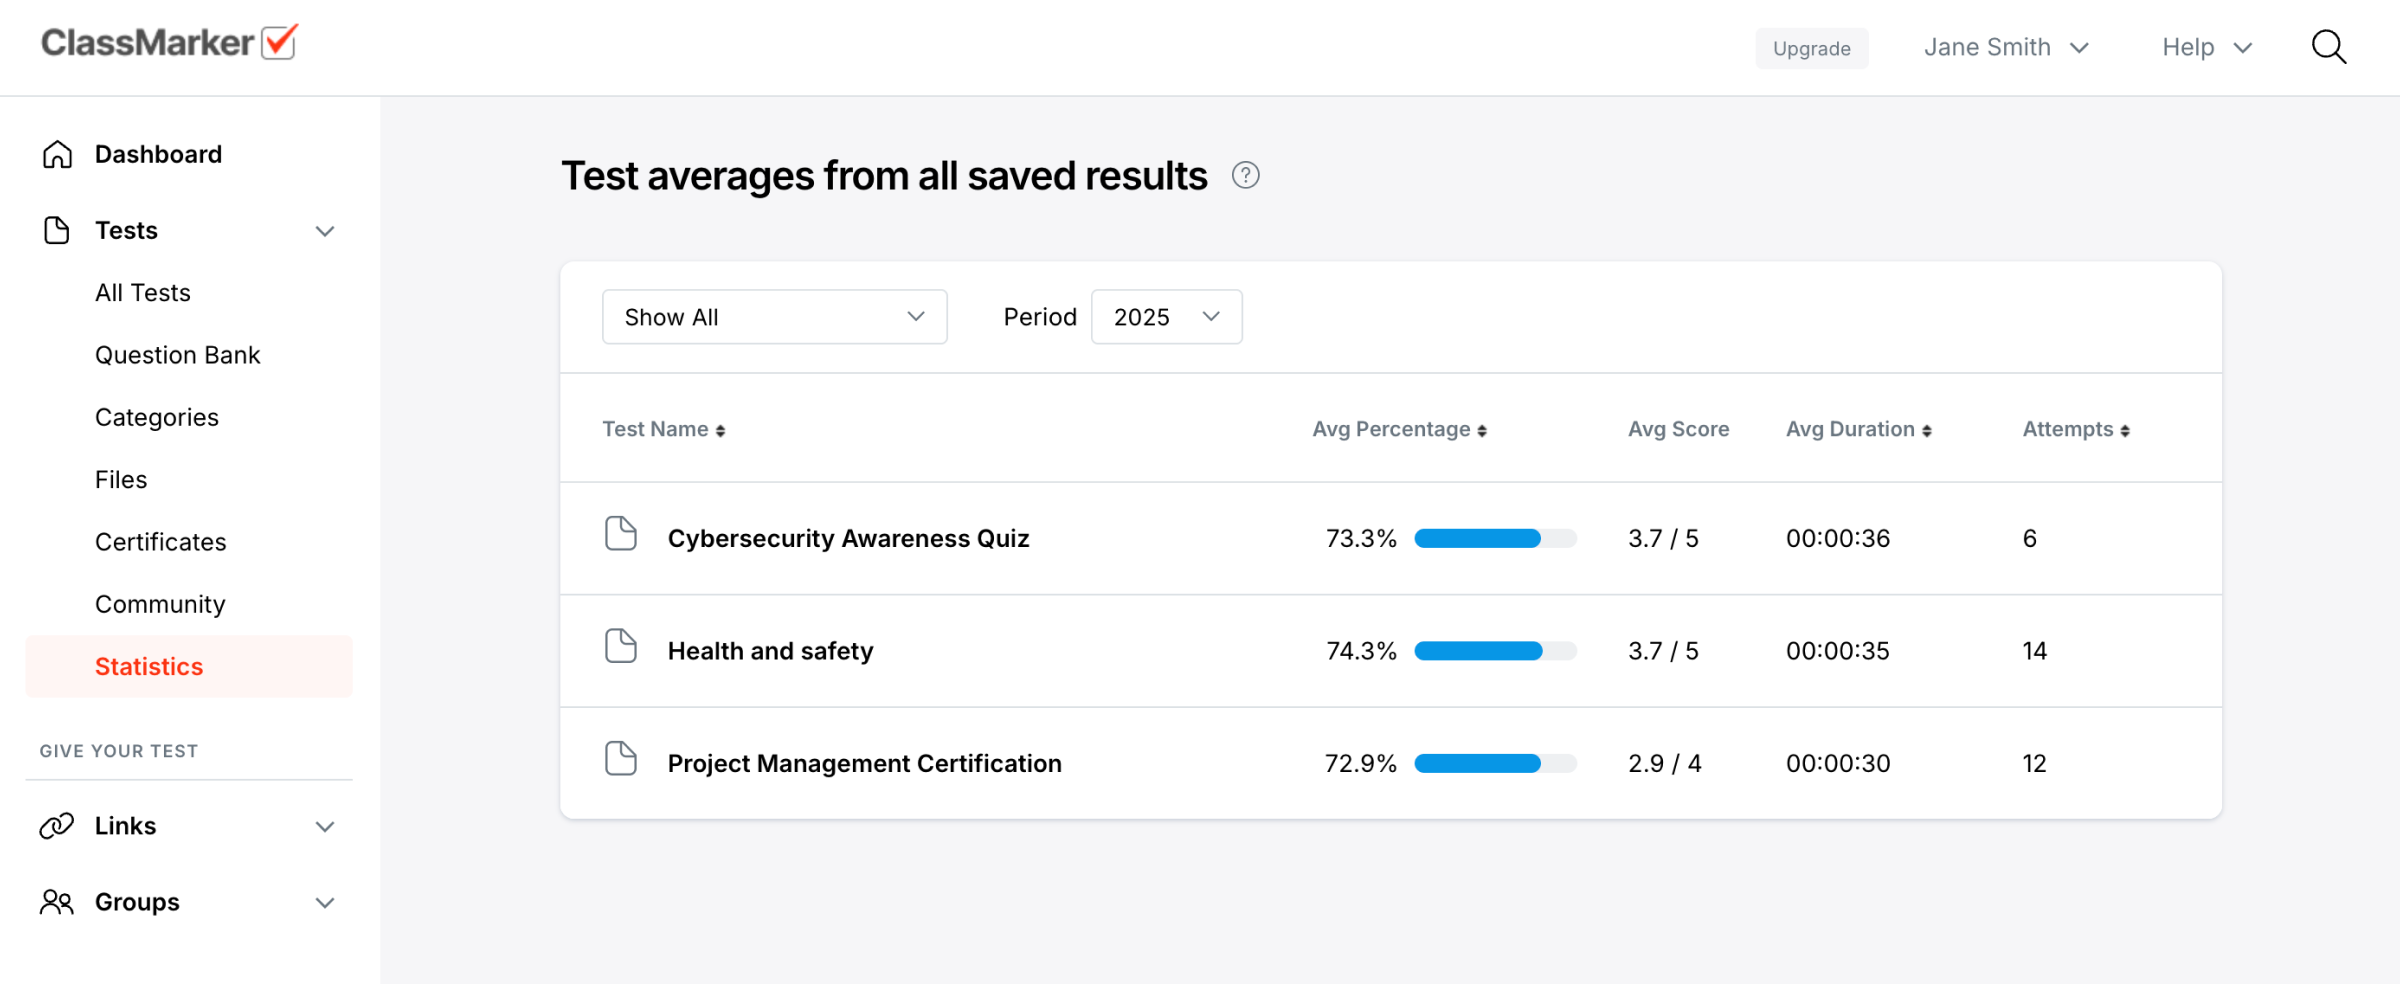
The Statistics page in each section allows you to compare results across all Tests, Links, or Groups. For example, if you’ve assigned a Test to multiple audiences using different Links, you can easily compare their performance.
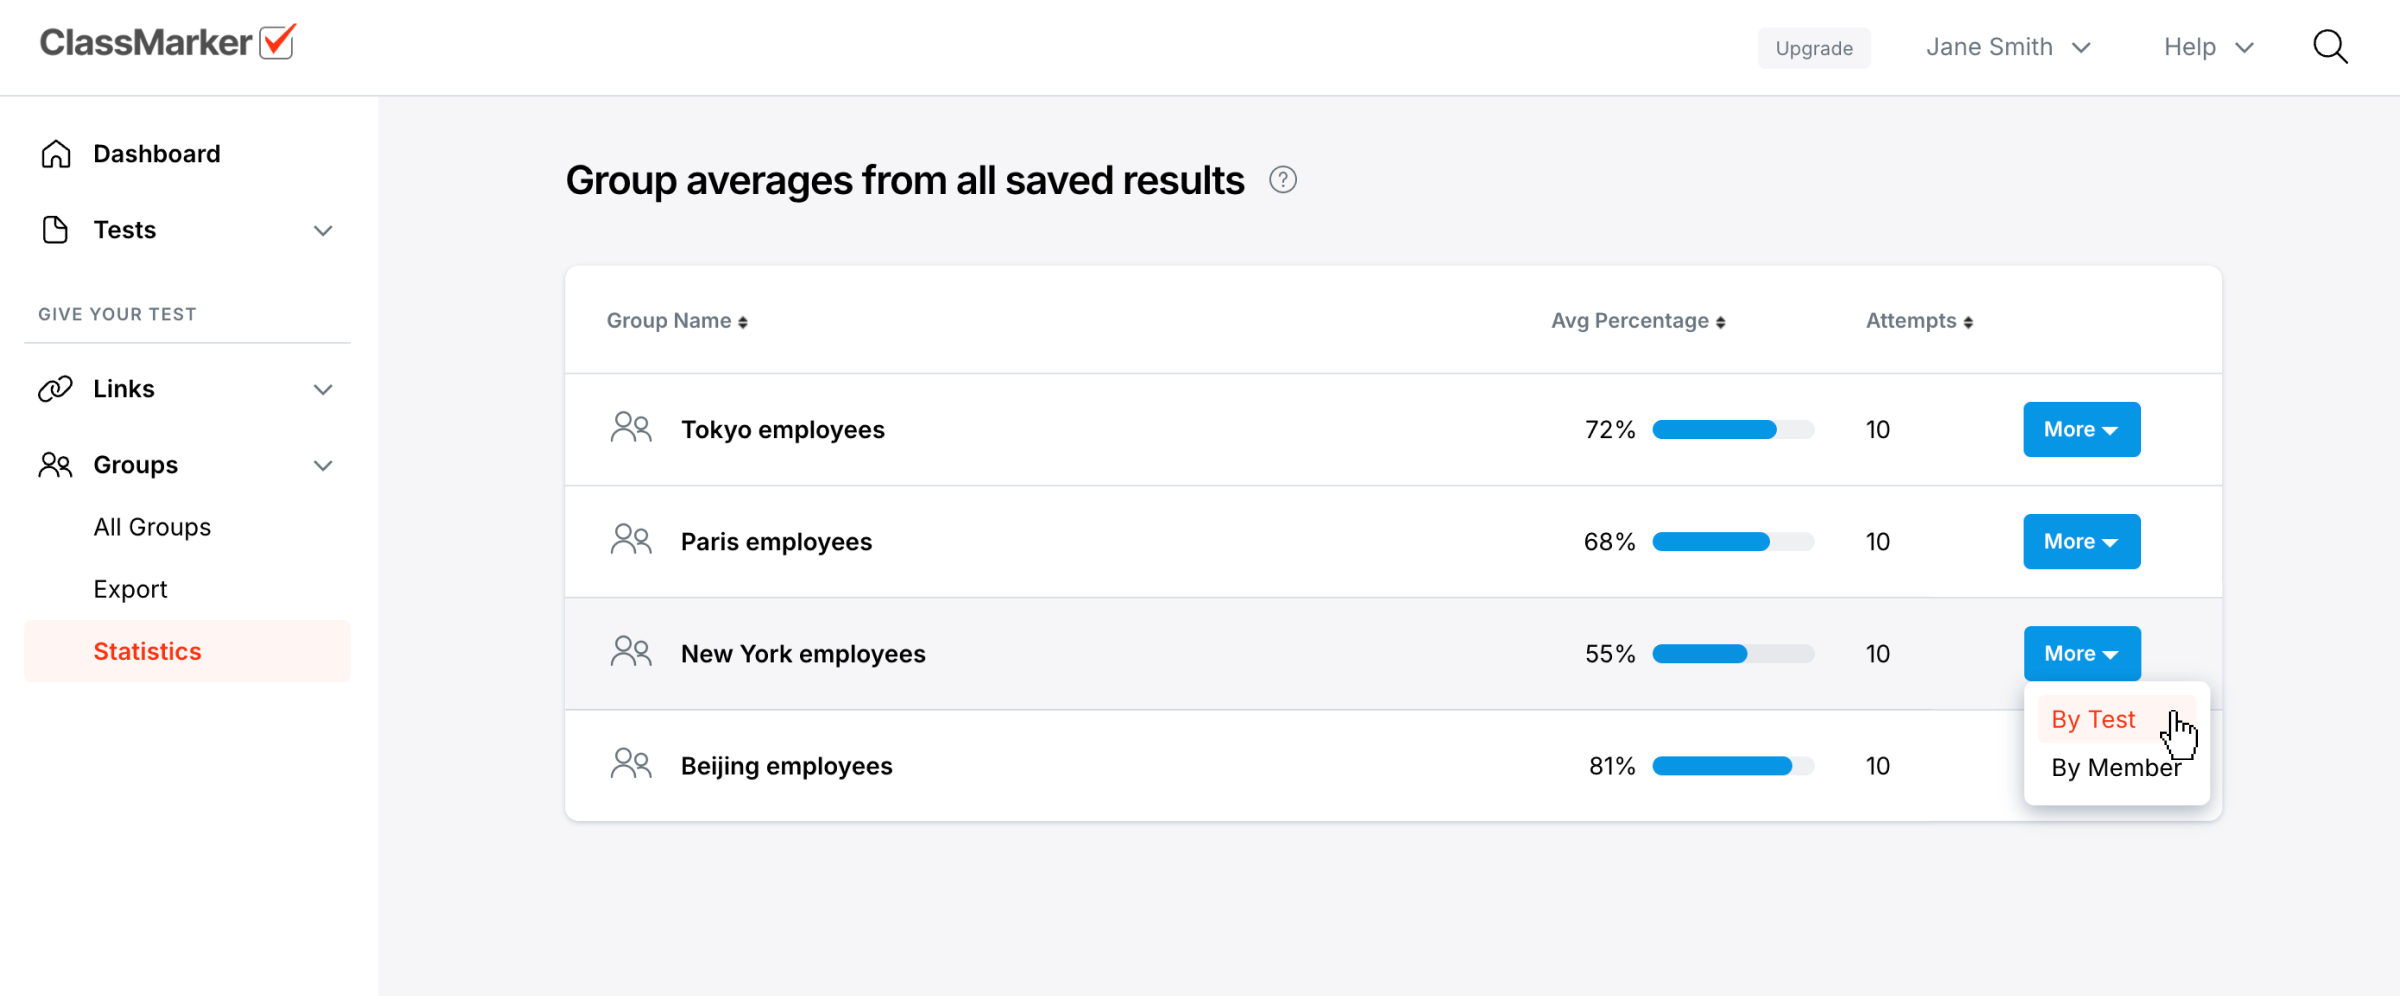
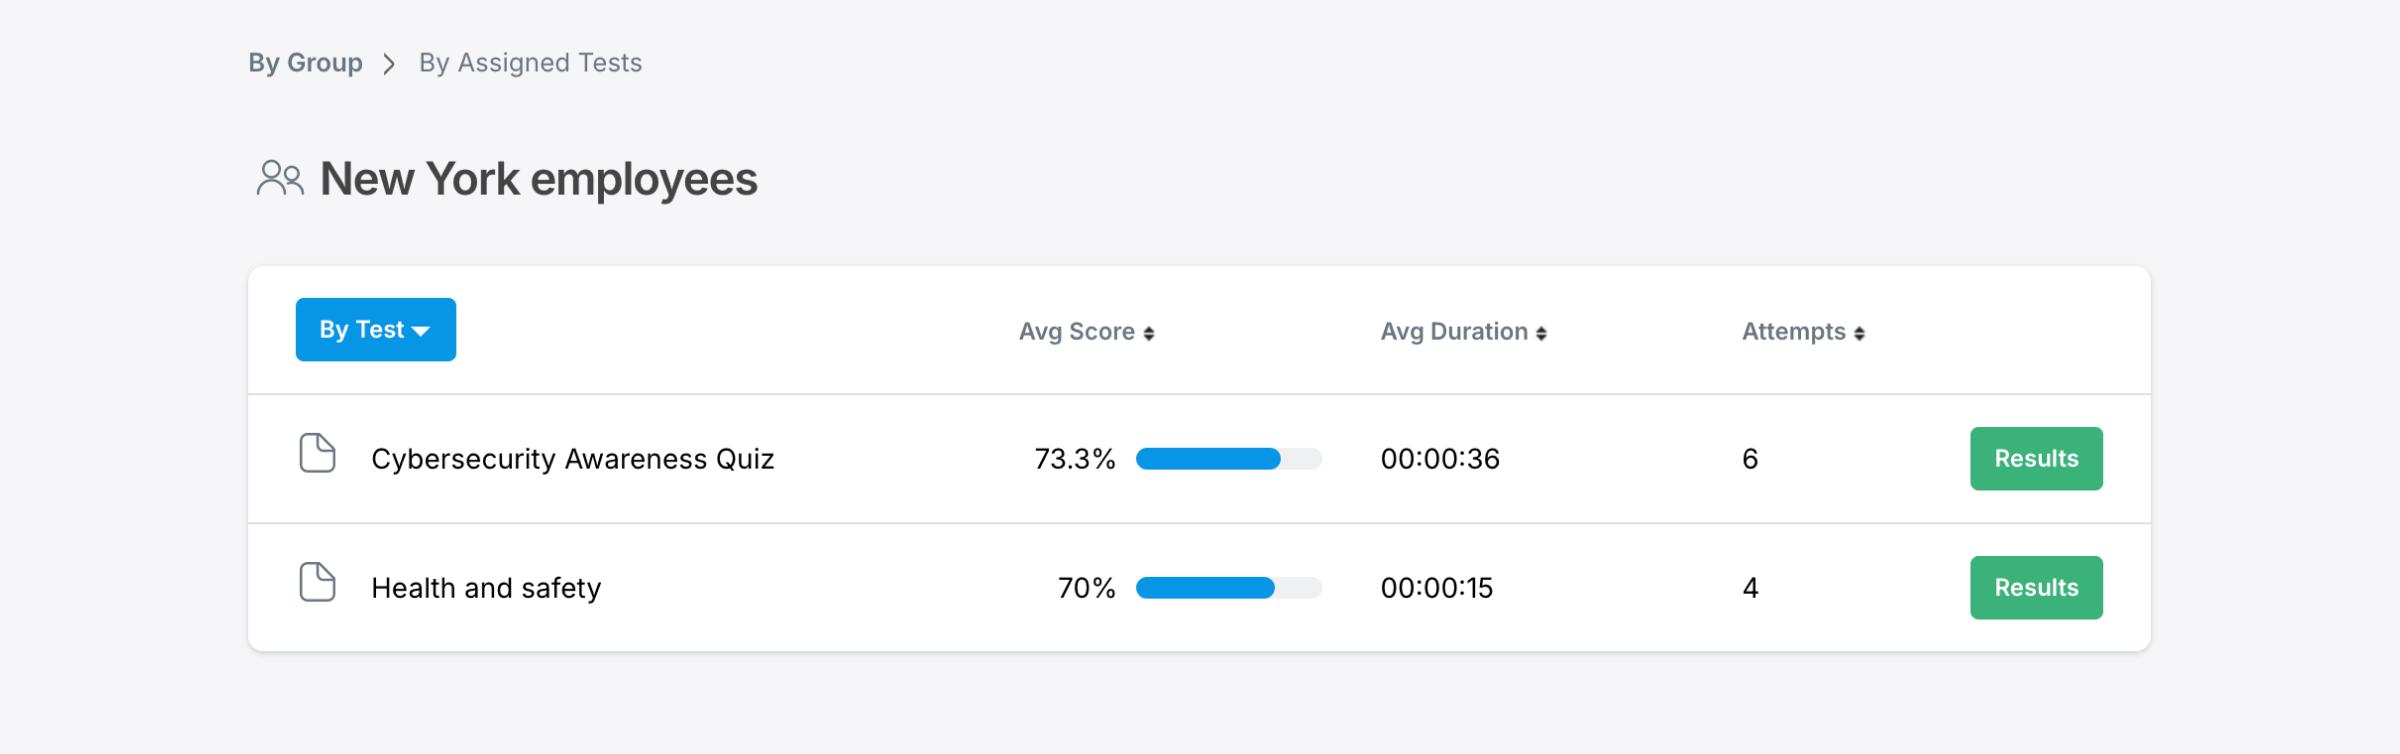
In addition to Statistics by Test, Link or Group, ClassMarker allows you to drill down to view Group-specific statistics.